What is a Buyer's market? - How to navigate the real estate market on Whidbey Island

Contributed by Si Fisher

If you're considering selling a home on Whidbey Island, understanding the dynamics of the real estate market is paramount. This guide aims to elucidate the concept of a buyer's market and how to navigate the ebbs and flows of the Whidbey Island real estate market.
Our geographical focus extends across all of Whidbey Island, including ClintonLangleyFreelandGreenbankCoupeville, and Oak Harbor

Deciphering the Buyer's Market

A buyer's market occurs when the number of homes for sale exceeds the number of potential buyers. This scenario often leads to buyers dictating the terms, which can result in more competitive prices and longer periods on the market for sellers. Understanding this fundamental concept can influence your approach when selling a home on Whidbey Island.


Navigating the Whidbey Island Real Estate Market

Given that market conditions can significantly impact your home buying/selling experience, partnering with a trusted Whidbey Island Realtor, well-versed with the Whidbey Island real estate trends, can be beneficial. They can provide vital knowledge and strategies to successfully navigate the local market.

Is Whidbey Island currently in a Buyer's or Seller's Market?

Assessing whether Whidbey Island is a buyer's or seller's market can be a complex process. The answer often depends on specific areas and can vary between Langley, Clinton, Freeland, Greenbank, Coupeville, or Oak Harbor real estate markets. A seasoned Whidbey Island Specialist can help you understand the unique market conditions of these locations. As of writing this article (6/29/23), Whidbey Island as a whole is still in a seller’s market, but not as heavily as during its peak a little more than a year ago.

Check out this week's Whidbey Island real estate stats!


The Role of a Whidbey Island Realtor

A local Whidbey Island Realtor can help determine the current market status. This assessment can be made based on a variety of factors including the number of homes for sale, average days on the market, and selling prices compared to listing prices.
If you're interested in learning more about the real estate market trends on Whidbey Island, or if you're considering selling your home, don't hesitate to reach out. Working with a Whidbey Island Specialist can provide you with the most accurate, up-to-date information, and the essential guidance needed to achieve your real estate goals. Reach out today and navigate your home selling journey with confidence.


Ready to take the leap and make your real estate goals a reality?

Contact your local Whidbey Island Realtor® today and let them help you navigate this seller's market, ensuring your real estate goals are met. Don't miss the opportunity to take advantage of the current seller's market or to prepare for a potential buyer's market in the future. We're here to help!

Article contributed by:

Contact a local expert to get expert advice about selling your home

Check out other articles below

2023 Top 10 Predictions | Mid-Year Update

Windermere Chief Economist Matthew Gardner revisits his Top 10 Predictions for 2023. Reviewing his forecasts for home prices, mortgage rates, and more, he highlights recent changes in the real estate market and updates his predictions for the near future.

This video is the latest in our Monday with Matthew series with Windermere Chief Economist Matthew Gardner. Each month, he analyzes the most up-to-date U.S. housing data to keep you well-informed about what’s going on in the real estate market.


Top 10 Real Estate Market Predictions 2023 | Mid-Year Update

Hello there, I’m Windermere Real Estate’s Chief Economist Matthew Gardner and welcome to this month’s episode of Monday with Matthew. You may remember that at the end of last year, I published my Top-10 Predictions for 2023 and, as we hit the mid-year mark, some of you have been asking me how well my forecasts have been holding up. So, I thought it would be interesting to take another look at them to see how accurate they have or have not been! These were the predictions I made last November, and they covered everything from my expectations for home sales and prices to shifting government policies.

U.S. Home Sale Prices

A line graph showing the year-over-year U.S. home sale prices from May 2022 to April 2023. The YOY price change drops from 15% to below 0%, while the MOM price change oscillates between roughly 4% and -4.5%, bottoming out in July of 2022.


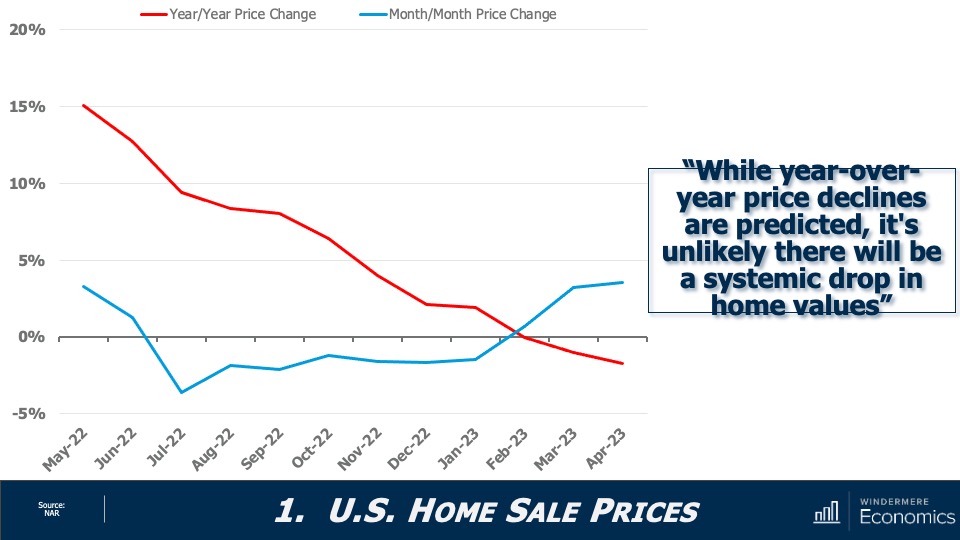
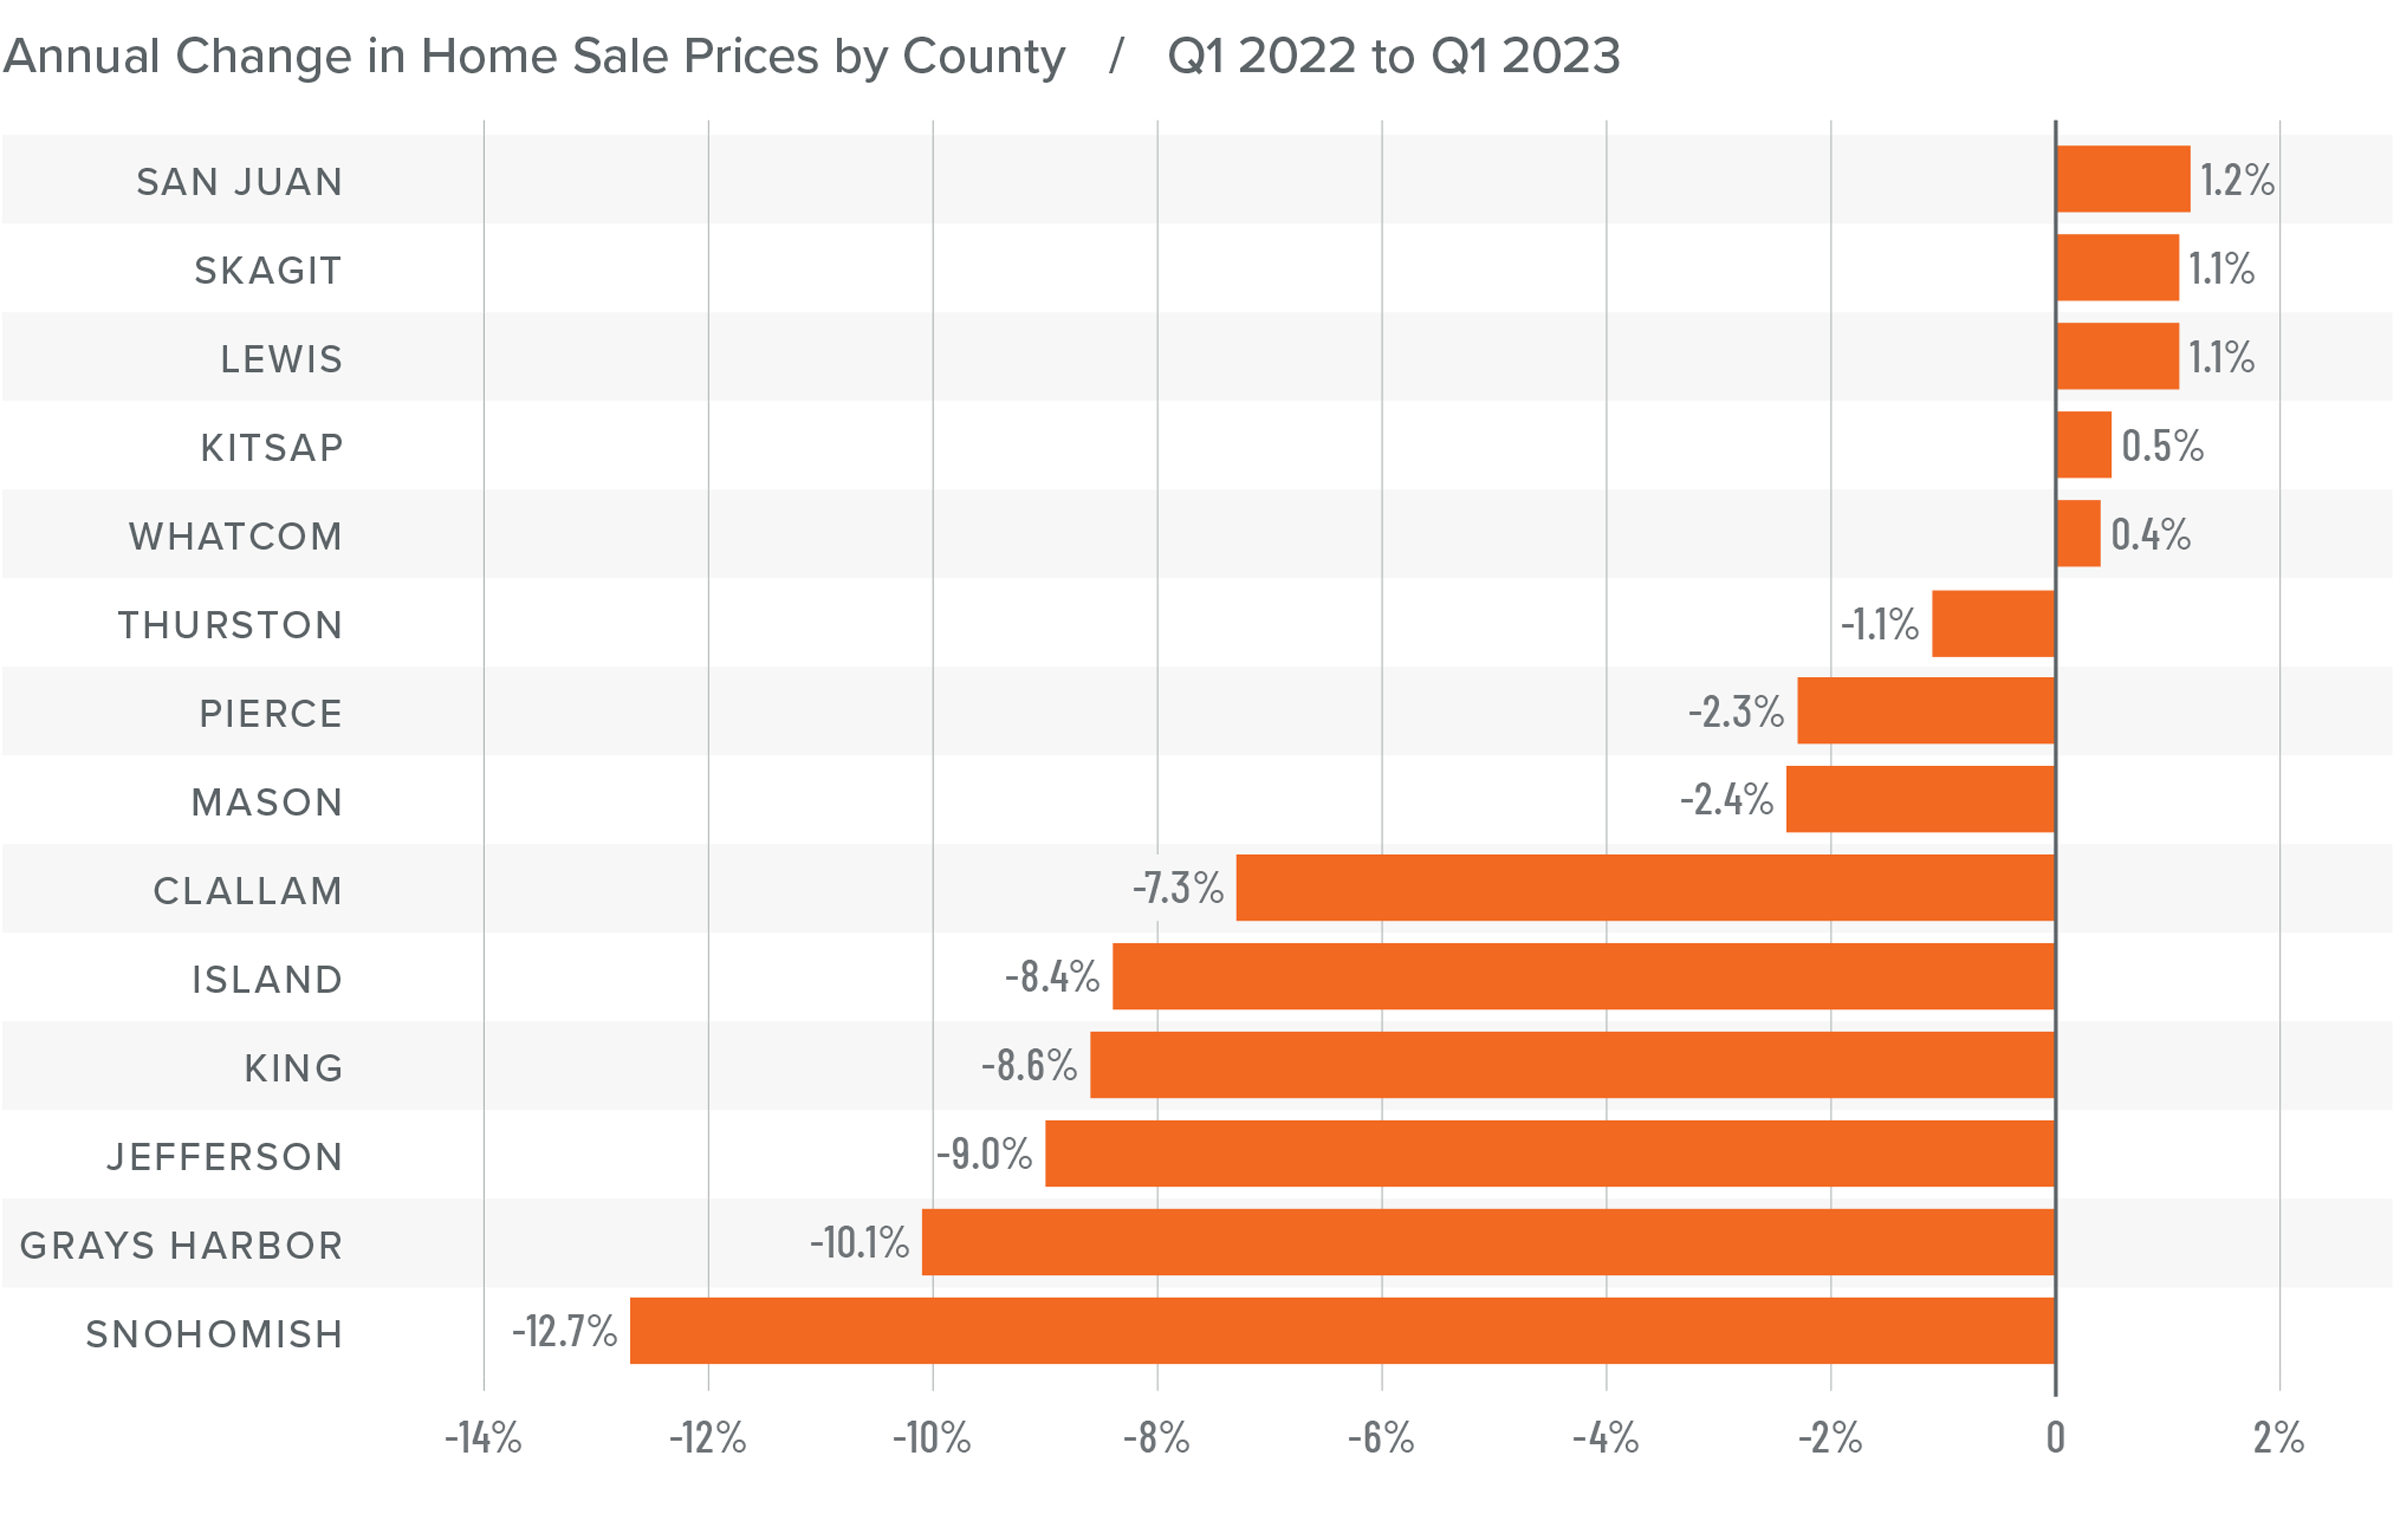
My first forecast suggested that sale prices would fall in 2023; however, I was not expecting any sort of systemic decline in values. Here you can see that year-over-year prices are down by a bit less than 2%, but when you look at how prices have changed month over month, they rose by 3.6% in April and are up by more than 6% since the end of last year.

I stand by my forecast that the median sale price in 2023 will be modestly lower than the 2022 number; and the monthly increase in sale prices that we have seen so far this year also supports my forecast that we are not seeing any long-term decline in home values.
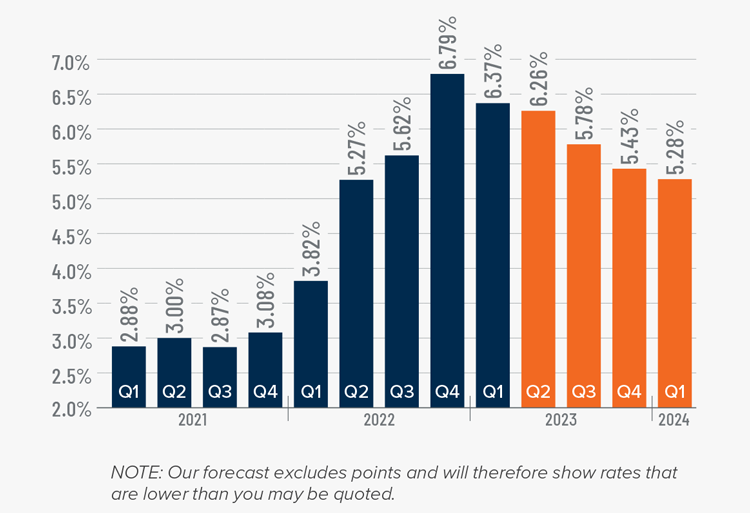
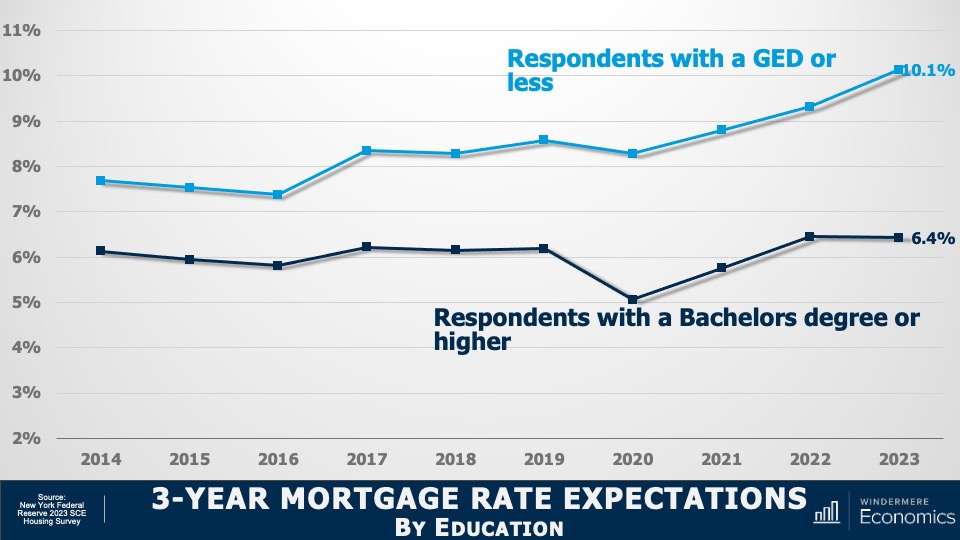
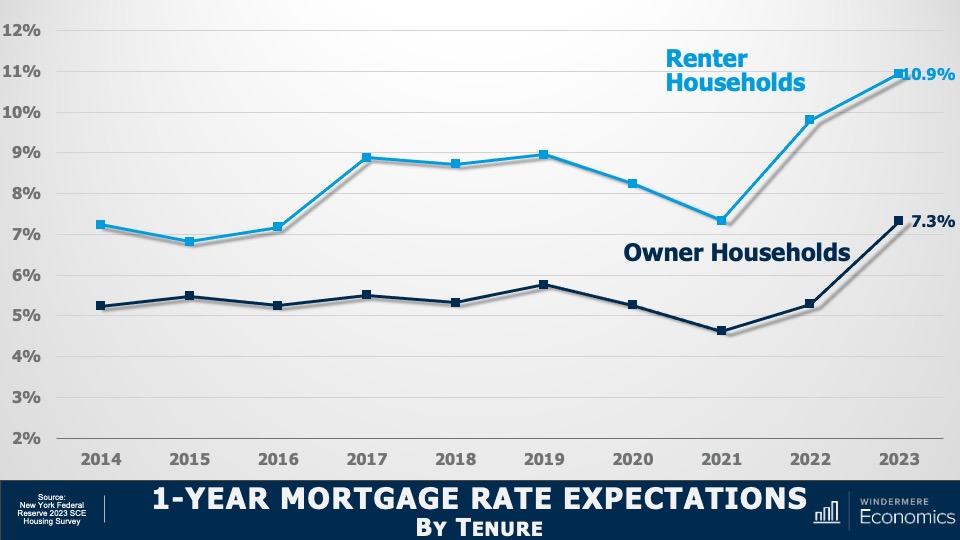
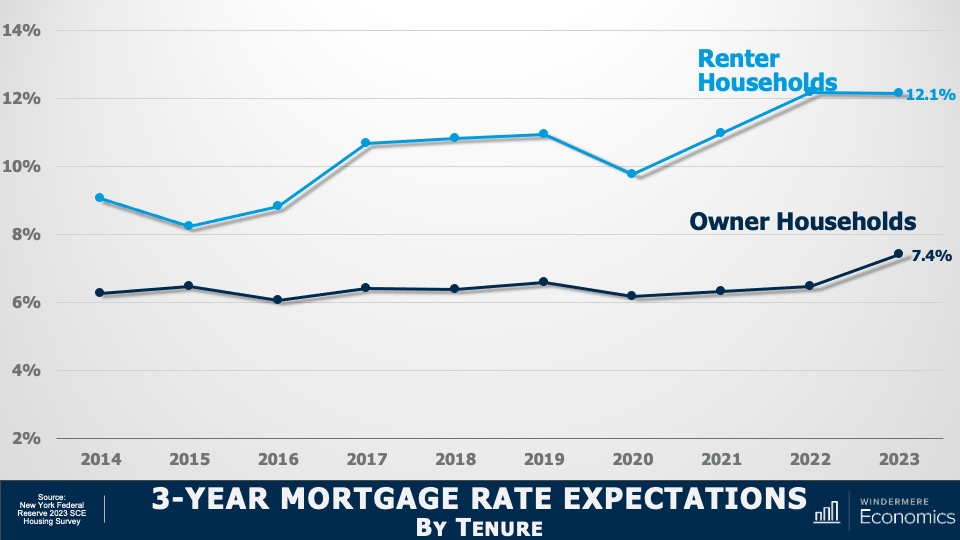
2023 Mortgage Rates

A line graph showing the mortgage rates so far in 2023, peaking above 7% in late February and late May. Otherwise, they have remained between 6% and 7%.


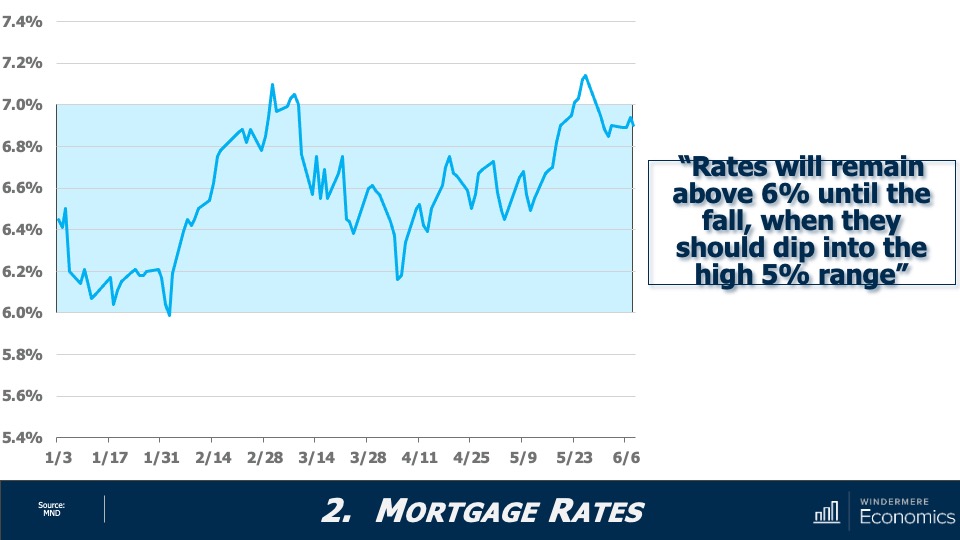
Although mortgage rates have broken above 7% eight times so far this year—the first time because of the banking crisis, and the second because of the looming debt ceiling—I expect them to become a little less frantic as we move through the second half of the year. That said, my call for them to drop below 6% this year is now likely to be inaccurate given where they are today. I still expect them to drop into the “fives” though, but not until early next year.

Is housing inventory increasing?

A line graph showing the inventory of homes for sale in the U.S. from January 2020 to March 2023. In million, the number has gradually decreased from just above 1.5 to just above 1.0, bottoming out between January and March 2022 at below 1.0.


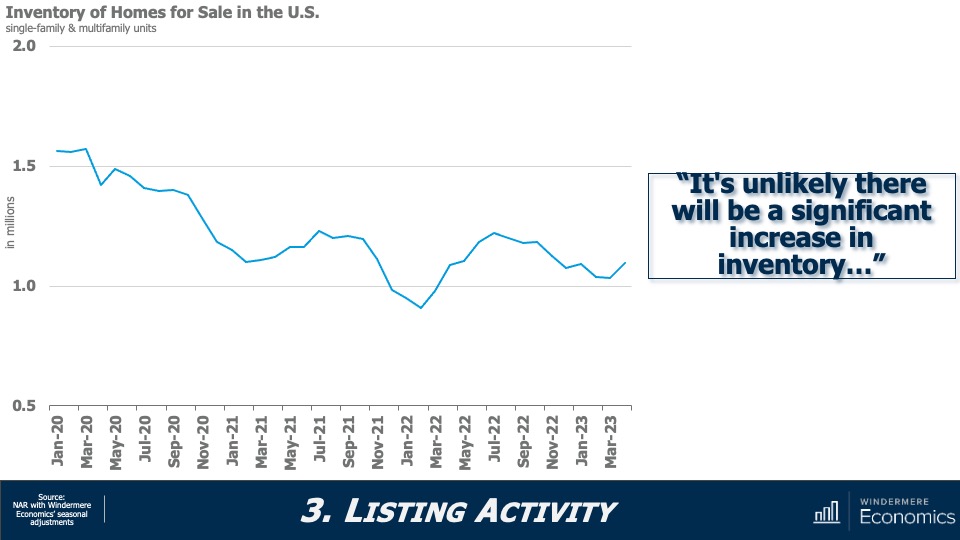
Listing activity saw a very modest late spring bump, but for perspective, the number of homes for sale is running at about 40% of its long-term average, and I still don’t see much growth this year. Why? Well, by my calculations, there could be over 20 million homeowners with mortgage rates around 3%. Why would they move!

Is 2023 a buyer’s or seller’s market?

A line graph showing the months of inventory for homes between 2017 and 2023, and whether that value corresponds to a seller's market, a balanced market, or a buyer's market. Most of the data points are in the seller's market range for these years, and Matthew Gardner predicts it is unlikely that we'll see a buyer's market in 2023.


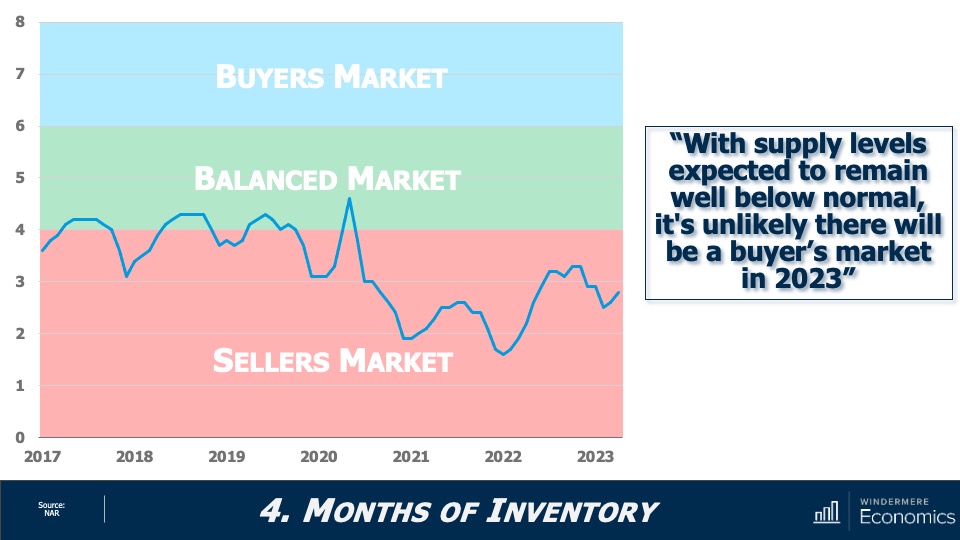
And with limited inventory, the market still “technically” favors home sellers. Now, this is a little speculative because what defines a traditional “buyer’s” or “seller’s” market varies by location, but with relatively few homes on the market and the share of homes with price reductions dropping and list prices rising again, I just can’t see a buyer’s market appearing this year.

Are home prices falling?

A line graph showing U.S. median list prices for homes between January 2022 and April 2023. Prices were roughly $330,000 in January 2022, climbing to almost $400,000 during summer 2022, bottoming out at below $370,000 around January 2023, and returning to $390,000 by April 2023.


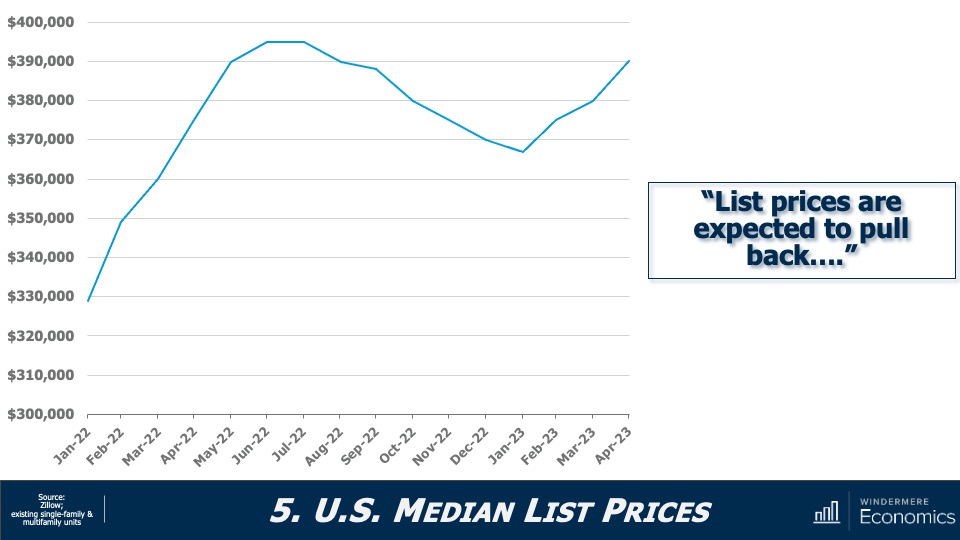
Well, this doesn’t look to be meeting my forecasts, does it! Sellers have been pretty bullish so far this year, but I would add that this is not true across the whole country. List prices are still down significantly in markets such as Hailey, Idaho; Jasper, Alabama; and Elko, Nevada, where list prices for single-family homes are down between 30 and 50% from their peak. So, I admit that the country has outperformed my forecast for list prices.

Return to Office Statistics 2023

A graph and table showing the number of U.S. employees subject to newly effective return-to-office mandates. May 2023 has the highest value at nearly 600,000 employees. Matthew Gardner predicts more employees will get clarity on these policies in 2023.


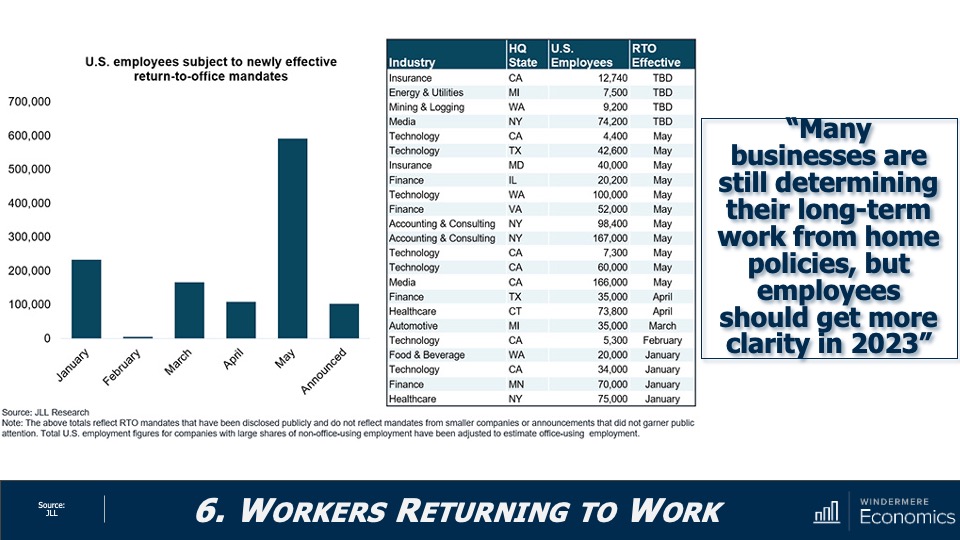
As I had expected, the pace of workers heading back to the office has not been very robust. In fact, the share of people in the office full time dropped to 42% in the second quarter of 2023, down from 49% in the first quarter, that according to The Flex Report. Meanwhile, the share of offices with hybrid work arrangements hit 30% in the quarter, up from 20% the previous quarter. But I still expect to see more workers heading back to their offices, albeit very reluctantly.

New Home Permits and Starts Have Fallen 

A line graph showing the number (in thousands) of U.S. single-family new home starts from January 2021 to March 2023. The numbers have almost entirely stayed in the 800-1,200 range, peaking above 1,200 in March 2021 and certain points between November and March 2022. In March 2023, the number of starts sat at just above 800,000.


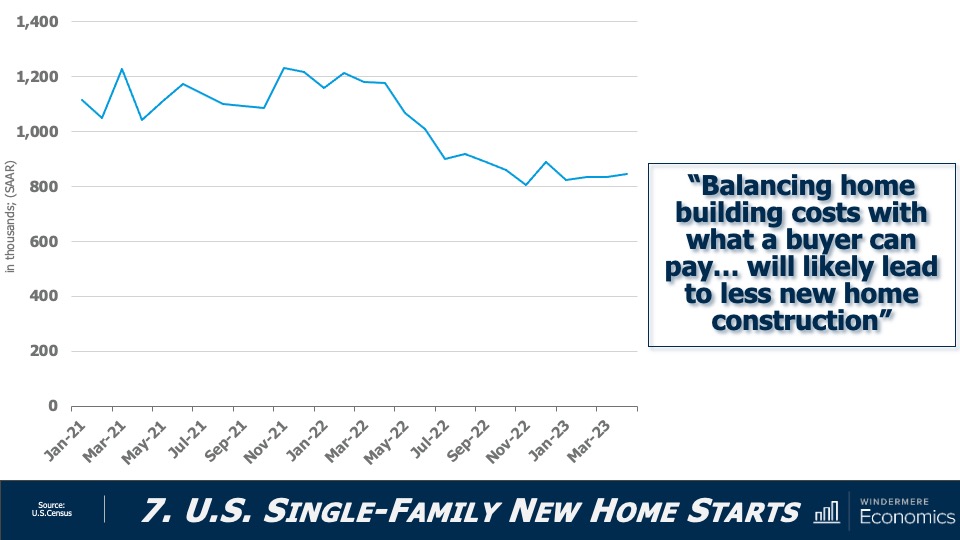
With new home permits down 21% year-over-year, and new home starts off by 28%, I think its accurate to say that activity in the new construction sector has slowed. Builders continue to be hit by high financing rates as well as high material prices.

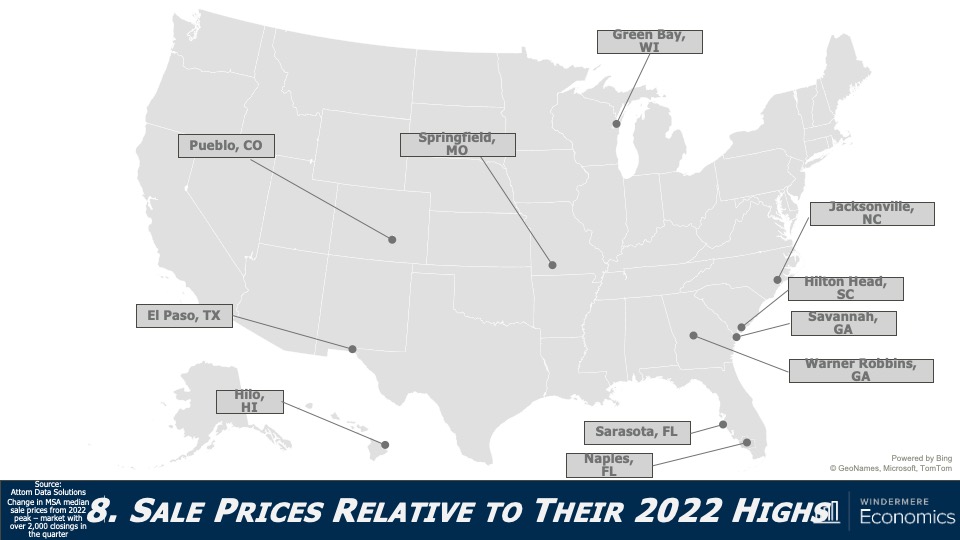
Are U.S. home prices dropping?

A map graphic showing 2023 U.S. home sale prices relative to their 2022 highs for select cities. Johnstown, PA has the greatest difference at -39.1% and Duluth has the least at -19.6%. Overall, Matthew predicts that the markets where home prices rose the fastest in recent years will experience a downturn.


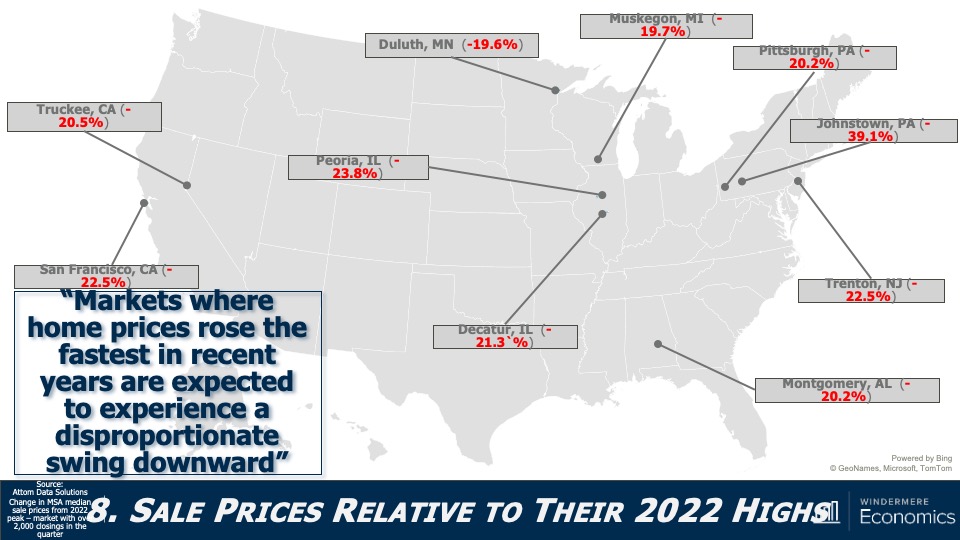
As we all know, not all markets are created equal, and this chart shows how far below their 2022 highs some of the country’s metro areas are. On the opposite end of the spectrum, there are some markets where prices have already exceeded the highs seen last year (see map below).


A map graphic showing 2023 U.S. home sale prices relative to their 2022 highs, specifically some markets where prices have already exceeded the highs seen last year: Pueblo, El Paso, Hilo, and others.


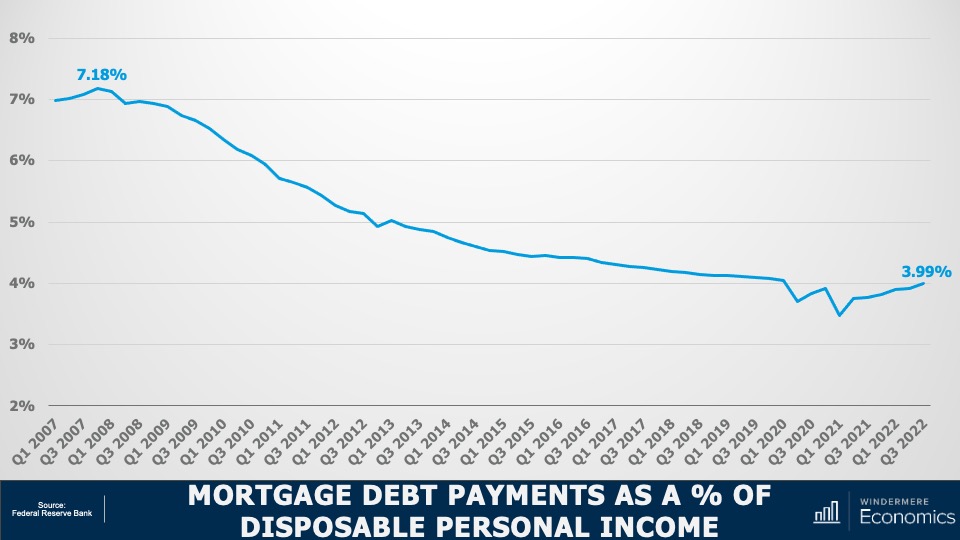
Housing Affordability 2023

A line graph showing a homeownership affordability index from January 2020 to March 2023. The affordability line sits at 100. From January 2020 to May 2021, the trend line was above 100. It consistently dipped after that until January 2023, sitting just below 80.


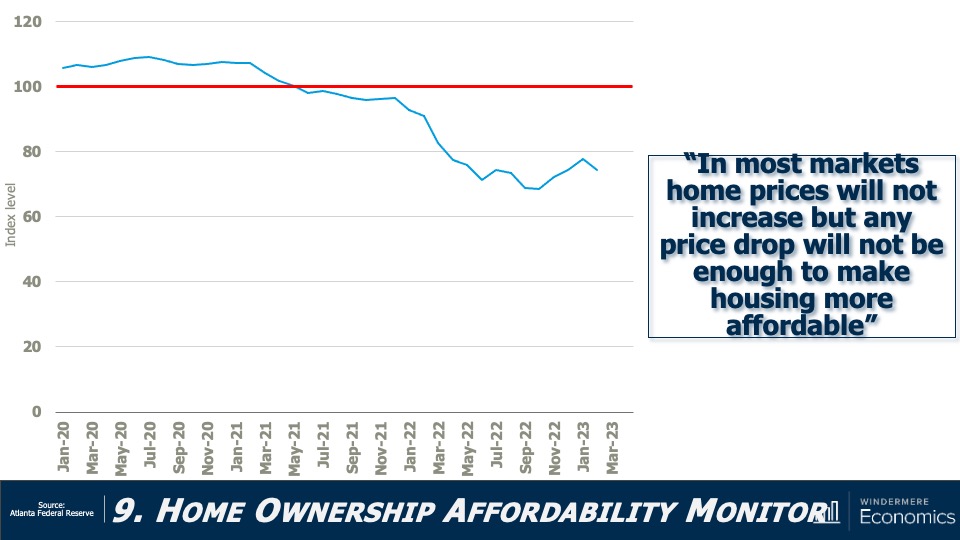
Affordability has not improved, mainly due to home prices that remain out of sync with incomes as well as financing costs that remain well above the level that buyers had become used to. I still believe that this will not improve in 2023.


A power point slide showing recent changes in support of zoning changes including House Bill 1110, The New York Housing Compact, Florida SB-88, and the Make Virginia Home Plan.


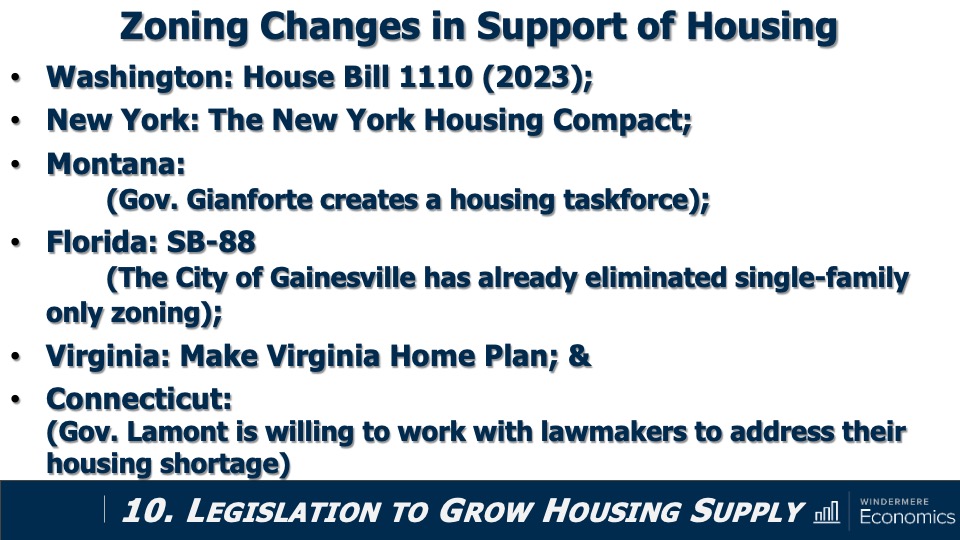
And finally, I told you that governments would start to move to address the significant housing shortage that the country is experiencing, and they have. As you can see, in Washington State, Governor Inslee recently signed House Bill 1110 into law which allows the development of duplex up to six-unit buildings within any area zoned for single-family-only development. Additionally, jurisdictions in a significant number of states are either pursuing legislation to tackle this problem or have at least created task forces to look at the issue. It’s a good start, but more needs to be done.

Although it’s really cheating to grade one’s own work, I think that I have been pretty accurate with my forecasts. Yes, I was too pessimistic when it came to list prices and a little optimistic regarding the direction of mortgage rates. But other than those two items, the data seems to suggest that the housing market is headed in the direction that I had suggested.

What do you think? I’d love to hear your thoughts on this subject so leave your comments below. As always, stay safe out there and I’ll see you all next month. Bye now.

To see the latest real estate market data for your area, visit our quarterly Market Updates page.


About Matthew Gardner

As Chief Economist for Windermere Real Estate, Matthew Gardner is responsible for analyzing and interpreting economic data and its impact on the real estate market on both a local and national level. Matthew has over 30 years of professional experience both in the U.S. and U.K.

In addition to his day-to-day responsibilities, Matthew sits on the Washington State Governors Council of Economic Advisors; chairs the Board of Trustees at the Washington Center for Real Estate Research at the University of Washington; and is an Advisory Board Member at the Runstad Center for Real Estate Studies at the University of Washington where he also lectures in real estate economics.

Article originally appears on windermere.com

What is a Sellers' market? - How to navigate the real estate market on Whidbey Island

Contributed by Si Fisher

In the beautiful locale of Whidbey Island, including Clinton, Langley, Freeland, Greenbank, Coupeville, and Oak Harbor, the real estate scene can fluctuate. Even though the market has slowed since 2021 & 2022, currently in 2023 we are seeing low inventory, moderately fewer days on market, and the pace is picking up.


What is a Sellers' Market?

In simple terms, a real estate sellers' market is where the demand for homes outweighs the supply. This condition tends to favor home sellers over buyers, creating a competitive environment that can result in bidding wars and homes selling above their listing price.


Are you wondering, "Is it a buyers' market or sellers' market?"

So far in 2023, Whidbey Island is still in a sellers' market. This makes it the ideal time for homeowners to consider selling their properties. Check out this weeks stats by clicking here for more details.

What does this mean for Homebuyers?

In a sellers' market, buying a home or buying an investment property can seem daunting. Homes are often sold swiftly, and buyers need to be prepared to make competitive offers. If you're a prospective homebuyer on Whidbey Island, understanding the dynamics of a sellers' market is crucial.


How do you navigate a sellers' market?

So, how can you navigate this sellers' housing market, whether you're looking to buy or sell? The key is partnering with a Whidbey Island Realtor® who is a specialist in the Whidbey Island real estate market. Someone who lives and works here. Within Windermere Whidbey we have a variety of brokers who have a deep understanding of the local market conditions and the expertise to guide you through the process.


In this sellers' market, working with a Whidbey Island Specialist can mean the difference between getting your dream home or selling your property at an optimal price. Their guidance can help you understand the market trends, whether it's a real estate buyers' market or sellers' market, ensuring you make informed decisions.


Remember, every housing market has its own unique trends and patterns, and the current sellers' market on Whidbey Island is no exception. So, whether you're looking to sell or buy a home in Freeland, Langley, or any other beautiful town on Whidbey Island, seeking professional advice from a local expert can make a world of difference.


Ready to take the leap and make your real estate goals a reality?

Contact your local Whidbey Island Realtor® today and let them help you navigate this sellers' market, ensuring your real estate goals are met. Don't miss the opportunity to take advantage of the current sellers market or to prepare for a potential buyers' market in the future. We're here to help!
Remember to bookmark this page and check back regularly for updates on the Whidbey Island housing market. We'll keep you informed, whether it's a buyers' or sellers' market, so you can make the best decision for your real estate needs.

Article contributed by:

Contact a local expert to get expert advice about selling your home

Check out other articles below

Would the FHFA Mortgage Fee Changes Have Favored Buyers with Low Credit Scores?

The Federal Housing Finance Authority recently put a hold on raising upfront mortgage fees given pushback that suggested home buyers with good credit were being penalized. Windermere Chief Economist Matthew Gardner looks at Loan Level Price Adjustments (LLPAs) to explain why some headlines were misleading.

This video on the proposed FHFA mortgage fee changes is the latest in our Monday with Matthew series with Windermere Chief Economist Matthew Gardner. Each month, he analyzes the most up-to-date U.S. housing data to keep you well-informed about what’s going on in the real estate market.


FHFA Mortgage Fee Changes

Hello there, I’m Windermere Real Estate’s Chief Economist Matthew Gardner, and welcome to this month’s episode of Monday with Matthew. As most of you are aware, the Federal Housing Finance Authority announced that they were going to raise the upfront fees for mortgages backed by Fannie Mae and Freddie Mac, and that led to significant backlash from some suggesting that borrowers with good credit would now be paying more than borrowers with bad credit.

And as these voices grew louder, Congress stepped in with House Financial Services Committee Chair Patrick McHenry and Housing and Insurance subcommittee Chair Warren Davidson announcing a plan to repeal these fee increases if they were introduced. Well, this did not go unnoticed, and the FHFA announced on May 10th that they were putting a hold on a new fee structure in order to engage industry stakeholders and better understand their concerns.

So, for now nothing has changed, but I still think it’s a subject worth discussing because we will see another proposal from the FHFA at some point in the future. So, what’s going on?

Well, periodically the FHFA raises the upfront fees that the Agencies charge borrowers for the purchase and refinance of mortgages that they guarantee, and these fees are called Loan Level Price Adjustments, or LLPAs.

In April of 2022, these fees went up for several types of loans including ones in expensive markets that have a higher conforming loan limit than seen nationally, and they also raised fees on second home mortgages. But to support affordable housing, the lower rates for certain programs including HomeReady, Home Possible, and HFA Advantage weren’t increased. And they didn’t raise fees for loans to first-time home buyers in high-cost areas if they earned at or below the area median income.

And the new round of fee increases that was scheduled to start in May of this year has many believing that it was just another subsidy given to households with lower credit that’s being paid for by households with better credit. But is that really an accurate statement? I don’t necessarily think so.

First off, the FHFA had to increase fees this year simply because they needed the money to cover higher capital requirements that went into effect last year, but that’s a topic for another day. For now, let’s take a look at the changes that would have been made.

Changes to LLPAs

A matrix chart showing the differences between the mortgage fee loan level price adjustments that were in place and the FHFA's proposed mortgage fee increases for credit scores ranging from 639 and 780. The matrix chart shows that seemingly, the changes do benefit those with lower credit scores. However, that is misleading.


The matrix you see here shows you the difference between the fee that was in place and the one that was proposed. Remember, this is not the actual fee itself, but the spread between the old and new pricing. And, as you can see, on face value it really does look to benefit borrowers with lower credit scores and penalize households with better credit. For example…

Changes to LLPAs: Credit Score 640 – 659

A matrix chart showing the differences between the mortgage fee loan level price adjustments that were in place and the FHFA's proposed mortgage fee increases for credit scores ranging from 639 and 780. The matrix chart shows that a household with a credit score of between 640 and 659 would see savings across all loan-to-value ranges.


A household with a credit score of between 640 and 659 would see savings across all loan-to-value ranges versus the following:

Changes to LLPAs: Credit Score 740 – 759

A matrix chart showing the differences between the mortgage fee loan level price adjustments that were in place and the FHFA's proposed mortgage fee increases for credit scores ranging from 639 and 780. The matrix chart shows that a household with a credit rating of 740 to 759 would be paying the same or more in most scenarios with fees increasing between 0.125% and three quarters of a percent.


A household with a credit rating of 740 to 759 who would be paying the same or more in all bar two scenarios with fees increasing between 0.125% and three quarters of a percent.

But is this really something to be worried about?

There are two things that stand out to me. The first is that a household putting down less than 20% has to buy private mortgage insurance. So, in reality, these households are actually less of a risk to the agencies than those who don’t, so isn’t it right that they should pay less in fees? Secondly, although I can’t disagree with anyone who states that families with lower credit will see fees go down and, generally speaking, they will go up for those with better credit, but people are confusing the CHANGE in the fee with the ACTUAL fee itself.

What I am saying is that low credit borrowers aren’t paying less than high credit borrowers. It’s just the spread in the rates between households with lower credit and those with higher credit has simply gotten smaller.

There is absolutely no scenario where someone with lower credit gets a lower fee. Let me show you.

Loan Level Pricing as of March 1, 2023

A matrix chart showing the differences between the mortgage fee loan level price adjustments that were in place and the FHFA's proposed mortgage fee increases for credit scores ranging from 639 and 780. The matrix chart shows the following scenario: There are two households wanting to buy houses and they are both looking to borrow 80% of the purchase price. One buyer has a credit score of 640, so their LLPA would be 2.25% of the loan amount or $9,000. The other buyer had a credit score of 740 so their fee would be 0.875%. That means the household with higher credit would be paying $5,500 less than the household with lower credit on a $400k loan.


This was the new pricing schedule had it actually come into effect. Now let’s say there are two households wanting to buy houses for $500,000 and both looking to borrow 80% of the purchase price.

One buyer has a credit score of 640, so their LLPA would be 2.25% of the loan amount, or $9,000. The other buyer had a credit score of 740 so their fee would be 0.875%. That means the household with higher credit would be paying $5,500 less than the household with lower credit on a $400k loan.

No one is arguing that households with lower credit scores would have paid less in upfront fees, but I actually don’t see a problem with that. Remember, Fannie and Freddie’s mission is, in part, to facilitate access to affordable housing. Moreover, these fees don’t even apply to non-conforming or jumbo loans and they don’t impact FHA or VA loans either.

Although I certainly don’t know where the FHFA will end up regarding fee changes, they will have to do something at some point. I just hope that any modified plan is presented in a way that fully describes the situation and isn’t one that’s able to be interpreted in a manner which allows for headlines that don’t describe the full picture.

As always, I’d love to hear your thoughts on this subject but, in the meantime, stay safe out there and I’ll see you all next month. Bye now.

To see the latest housing data for your area, visit our quarterly Market Updates page.


About Matthew Gardner

As Chief Economist for Windermere Real Estate, Matthew Gardner is responsible for analyzing and interpreting economic data and its impact on the real estate market on both a local and national level. Matthew has over 30 years of professional experience both in the U.S. and U.K.

In addition to his day-to-day responsibilities, Matthew sits on the Washington State Governors Council of Economic Advisors; chairs the Board of Trustees at the Washington Center for Real Estate Research at the University of Washington; and is an Advisory Board Member at the Runstad Center for Real Estate Studies at the University of Washington where he also lectures in real estate economics.

Article originally appears on windermere.com

10 Costs Associated with Selling Your Home on Whidbey Island

Contributed by Si Fisher

Are you considering selling your home or property on Whidbey Island? It's essential to understand the costs associated with selling your home before you list it. Here at Windermere Whidbey, we are experts in helping people sell their homes in the Whidbey Island area, including Langley, Clinton, Freeland, Greenbank, Coupeville, and Oak Harbor. In this article, we will go over the costs associated with selling a home on Whidbey Island and provide you with valuable information to help you make informed decisions.


1. Brokerage Fees

Business Agreement Whidbey Island Real Estate

One of the costs when selling a home is the compensation paid to your real estate agent. The compensation rate is most commonly a percentage of the sale price of the home, but this rate may vary depending on the real estate agent you work with. At Windermere Whidbey, we offer the highest quality in professional services, and our experienced agents will guide you through the entire process of selling your home.


2. Closing Costs

Whidbey Island Selling a Home Closing Costs

Closing costs are fees associated with the closing of your home sale. These fees may include title insurance, escrow fees, appraisal fees, and attorney fees. Closing costs can add up to 2-3% of the sale price of your home.


3. Home Repairs and Maintenance

Whidbey Island Home Repairs Costs

Before listing your home, it's essential to make necessary repairs and do some maintenance to increase the value of your home. Some repairs may include fixing plumbing or electrical issues, updating appliances, or painting. These repairs can cost anywhere from a few hundred dollars to several thousand dollars, depending on the extent of the repairs needed.  Find an experienced real estate agent in your market who can advise you on the repairs that are going to net you the best return on investment and that will help get your home sold in your preferred timeline.


4. Home Staging and Cleaning

Whidbey Island Home Staging and Cleaning Costs

A well-staged and clean home can significantly increase the chances of selling your home quickly and at a higher price. Professional home staging services can cost anywhere from $500 to $5,000. Professional cleaning services can cost between $100 to $500, depending on the size of your home.  A local Windermere Whidbey broker can easily setup a consultation with their preferred stagers on the island.


5. Home Inspection

Whidbey Island Home Inspection Costs

A pre-inspection of your home is something you may want to consider having done before listing your home to identify any issues that need to be fixed before the sale. Having this done can prevent any major surprises during a transaction that may cause it to fail or put you at a disadvantage in negotiations.  If you have a sale fail, it can be damaging to the value of your home and effect your preferred sale timelines.   A home inspection can cost anywhere from $400 to $1,000, depending on the size of your home, and any ancillary services that potentially need to be added.  Typically the standard "Full Home Inspection" packages are sufficient as a prelisting inspection and range from $400-500 for most homes.


6. Property Taxes

Whidbey Island Property Taxes

Property taxes are typically paid through the end of the year, and you may be required to pay a prorated amount for the time you owned the home during the year. Property taxes can be up to 1% of the sale price of your home.


7. Capital Gains Tax

Whidbey Island Capital Gains

If your home has increased in value since you purchased it, you may be required to pay capital gains tax. However, if you have lived in the home for at least two of the past five years, you may be exempt from paying capital gains tax up to $250,000 if you are single and $500,000 if you are married.


8. Moving Costs

Whidbey Island Moving Costs

Moving costs can add up quickly, especially if you are moving to a new city or state. The cost of moving depends on several factors, including the distance, the size of your home, and the amount of belongings you need to move.


9. Homeowner Association Fees
home owners association fees whidbey island

If you live in a community with a homeowner association, you may be required to pay fees associated with selling your home, such as transfer fees or disclosure fees.   Depending on the transaction negotiations you may be on the hook for paying off any levied assessment fees, and in rare cases contributing to pending assessments projected costs as well.  It's important to work with a local broker who will not only help you navigate these concerns prior to listing, but also negotiate on your behalf once your property is under contract.


10. Miscellaneous Fees

Whidbey Island Miscellaneous Fees

In addition to the fees mentioned above, you may also encounter other fees associated with selling your home on Whidbey Island, such as home warranty fees or home inspection repair costs. It's important to budget for these additional fees to avoid any unexpected expenses during the home selling process.

Septic and well inspections are two other things that often are important to look at especially on Whidbey Island.  These can be conducted prior to listing giving you an opportunity to make any corrections needed, paving the way for a smooth transaction and allowing you to attract the largest buyer pool.  If you opt not to have these done prior to listing it may cause bumps in the road leading to a sale fail, or a disadvantaged position during negotiations.  An experienced local broker is going to be your best advisor on these matters when making an informed decision on how to proceed.

Another aspect that shouldn't be overlooked is the importance of curb appeal. The first impression that your home makes on potential buyers is crucial, and the exterior of your home plays a significant role in that impression. A well-maintained and aesthetically pleasing landscape can significantly increase the value of your home and attract potential buyers.

However, landscaping costs can vary widely depending on the size of your yard and the amount of work required. Some landscaping costs may include lawn care, tree trimming, mulching, and planting flowers. It's important to budget for these costs to ensure that your home looks its best and stands out from the competition.

At Windermere Whidbey, we understand the importance of presenting your home in the best possible light. Our experienced agents can provide you with valuable advice on how to improve your home's curb appeal and maximize its value. Contact us today to schedule a consultation with a Whidbey Island specialist and start the process of selling your home with confidence.


Contact a Windermere Whidbey Real Estate Agent Today

Windermere Whidbey is a full-service real estate company with over 50 years of experience in the Washington real estate market. We have a team of experienced real estate agents who can help you sell your home for the best possible price. Contact us today to learn more about our services and how we can help you sell your home.

Article contributed by:

Contact a local expert to get expert advice about selling your home

Q1 2023 Western Washington Real Estate Market Update

Download the printable PDF by clicking this link!

The following analysis of select counties of the Western Washington real estate market is provided by Windermere Real Estate Chief Economist Matthew Gardner. We hope that this information may assist you with making better-informed real estate decisions. For further information about the housing market in your area, please don’t hesitate to contact your Windermere Real Estate agent.


Regional Economic Overview

The pace of employment growth in Western Washington continues to slow. The region added only 90,340 new jobs over the past 12 months. That said, the annual pace of employment growth was a respectable 3.6%. Three counties have not recovered completely from their pandemic job losses: Whatcom, Skagit, and Snohomish. However they are short by just under 10,000 jobs, which should be recovered by this fall. Regionally, the unemployment rate in February was 4.1%, which was marginally above the 3.8% level of a year ago. The employment outlook has improved modestly, with the likelihood of a recession in 2023 down to about 50%. That said, I expect the pace of job growth to continue to slow as businesses remain concerned about a contraction in consumer spending, as well as facing tighter credit conditions following recent bank failures.

Western Washington Home Sales

❱ In the first quarter of the year, 10,335 homes sold. This was down 30.9% from the same period in 2022 and 18.9% lower than in the fourth quarter of 2022.

❱ Lower sales activity was more a function of the limited number of homes for sale than anything else. Listing activity in the first quarter of 2023 was down 43% from the final quarter of 2022.

❱ Home sales fell across the board compared to the same quarter of last year and were lower in every county compared to the final quarter of 2022.

❱ Pending sales rose in all but three counties compared to the fourth quarter of 2022. This suggests that sales in the second quarter of the year may tick higher. That said, the region is in dire need of more inventory.

A bar graph showing the annual change in home sales for various counties in Western Washington from Q1 2022 to Q1 2023. All counties have a negative percentage year-over-year change. Here are the totals: San Juan at -7.8%, Island at -21.9%, Skagit -23.6%, Kitsap -26.6%, Mason -28.2%, Lewis -29.3%, Pierce -29.7%, King -31.7%, Whatcom -32%, Snohomish -32.4%, Clallam and Grays Harbor -32.7%, Thurston -36%, and Jefferson -36.9%.

Western Washington Home Prices

❱ Home prices fell an average of 6.9% compared to the first quarter of 2022 and were 1.3% lower than in the fourth quarter of 2022. The average home sale price in the first quarter of 2023 was $692,866.

❱ Compared to the fourth quarter of 2022, prices were higher in Kitsap, Skagit, Lewis, San Juan, and Whatcom counties.

❱ Even though prices fell in the region, five counties saw sale prices rise very modestly from the first quarter of 2023.

❱ It’s worth noting that median listing prices rose in all but two markets compared to the previous quarter. This suggests that sellers are getting a little more comfortable with the market. If listing prices continue to rise, one can surmise that home prices will follow suit.

A map showing the real estate home prices percentage changes for various counties in Western Washington. Different colors correspond to different tiers of percentage change. Grays Harbor and Snohomish Counties have a percentage change in the -12.7% to -9.5% range, Clallam, Jefferson, Island, and King counties are in the -9.4% to -6.2% change range, Whatcom, Mason, Thurston, and Pierce are in the -2.8% to 0.4% change range, and Lewis, San Juan, and Skagit counties are in the 0.5%+ change range.

A bar graph showing the annual change in home sale prices for various counties in Western Washington from Q1 2022 to Q1 2023. San Juan County tops the list at 1.2%, followed by Skagit and Lewis at 1.1%, Kitsap at 0.5%, Whatcom at 0.4%, Thurston at 1.1%, Pierce at -2.3%, Mason at -2.4%, Clallam at -7.3%, Island at -8.4%, King at -8.6%, Jefferson at -9%, Grays Harbor at -10.1%, and finally Snohomish at -12.7%.

Mortgage Rates

Rates in the first quarter of 2023 were far less volatile than last year, even with the brief but significant impact of early March’s banking crisis. It appears that buyers are jumping in when rates dip, which was the case in mid-January and again in early February.

Even with the March Consumer Price Index report showing inflation slowing, I still expect the Federal Reserve to raise short-term rates one more time following their May meeting before pausing rate increases. This should be the catalyst that allows mortgage rates to start trending lower at a more consistent pace than we have seen so far this year. My current forecast is that rates will continue to move lower with occasional spikes, and that they will hold below 6% in the second half of this year.

A bar graph showing the mortgage rates from Q1 2021 to the present, as well as Matthew Gardner's forecasted mortgage rates through Q1 2024. After the 6.79% figure in Q4 2022 and 6.37% in Q1 2023, he forecasts mortgage rates dipping to 6.26% in Q2 2023, 5.78% in Q3 2023, 5.43% in Q4 2023, and 5.28% in Q1 2024.

Western Washington Days on Market

❱ It took an average of 56 days for a home to sell in the first quarter of this year. This was 32 more days than in the same quarter of 2022 and 16 days more than in the fourth quarter of last year.

❱ King County remains the tightest market in Western Washington, with homes taking an average of 41 days to sell. Homes in San Juan County took the longest time to sell.

❱ Market time rose in all counties contained in this report compared to the same period in 2022 and compared to the fourth quarter.

❱ The greatest increase in market time compared to a year ago was in Grays Harbor County, where it took an average of 41 more days for homes to sell. Grays Harbor County also saw the greatest increase in market time compared to the final quarter of 2022 (from 46 to 76 days).

A bar graph showing the average days on market for homes in various counties in Western Washington for Q1 2023. King County has the lowest DOM at 41, followed by Snohomish at 42, Kitsap at 46, Pierce and Island at 49, Thurston at 50, Jefferson and Skagit at 51, Whatcom at 54, Mason at 57, Clallam at 66, Lewis at 68, Grays Harbor at 76, and San Juan at 89.

Conclusions

This speedometer reflects the state of the region’s real estate market using housing inventory, price gains, home sales, interest rates, and larger economic factors.

Although the regional economy is still expanding, it continues to show signs of slowing. With the probability of a national recession this year now fifty-fifty, I do not see any reason for buyers to lose confidence in their housing decisions based purely on economic factors. Sellers appear to be a little more confident in the market as demonstrated by rising listing prices. Periods of lower mortgage rates and the lack of homes for sale are both likely contributors to this. Whatever the case may be, I am not seeing any signs of panic in the market.

A speedometer graph indicating a balanced market, leaning toward a seller's market in Western Washington in Q1 2023.

Even in the face of higher financing costs, low inventory levels support home values, and the data suggests that the worst of the price declines are now behind us. The region had fewer sales, modestly lower prices, and higher average days on market, all of which favor home buyers. However, lower inventory levels, higher pending sales, higher listing prices, and a higher absorption rate of homes that are for sale favor sellers. As such, I am moving the needle towards a balanced market, but one that ever so slightly favors sellers.

About Matthew Gardner

Matthew Gardner - Chief Economist for Windermere Real Estate

As Chief Economist for Windermere Real Estate, Matthew Gardner is responsible for analyzing and interpreting economic data and its impact on the real estate market on both a local and national level. Matthew has over 30 years of professional experience both in the U.S. and U.K.

In addition to his day-to-day responsibilities, Matthew sits on the Washington State Governors Council of Economic Advisors; chairs the Board of Trustees at the Washington Center for Real Estate Research at the University of Washington; and is an Advisory Board Member at the Runstad Center for Real Estate Studies at the University of Washington where he also lectures in real estate economics.

Mortgage Rate Predictions and Misconceptions

The Federal Reserve Bank of New York just released their 2023 Housing Survey, which shows how the U.S. population feels about the housing market. Windermere Chief Economist Matthew Gardner digs into the mortgage rate predictions, showing how demographics played a role in the results.

This video on mortgage rate predictions is the latest in our Monday with Matthew series with Windermere Chief Economist Matthew Gardner. Each month, he analyzes the most up-to-date U.S. housing data to keep you well-informed about what’s going on in the real estate market.


Mortgage Rate Predictions

Hello there! I’m Windermere Real Estate’s Chief Economist Matthew Gardner. This month we’re going to take a look at the latest SCE Housing Survey, which gives us a really detailed look at consumers’ psyche in regard to the housing market.

I’ve always been fascinated by surveys, as they frequently give me insights that I simply don’t get from just looking at raw data and, as luck would have it, the New York Fed just released its 2023 Consumer Expectations Housing Survey. Now, this particular survey has always given me some great and often surprising insights as to how the U.S. population views the overall housing market. We certainly don’t have time to cover all of the questions that the survey poses, but there was one section I wanted to share with you today as it really resonated with me, and it relates to mortgage rates.

Will mortgage rates continue to rise?

A double line graph showing mortgage rate predictions. Specifically, it shows the average interest rates for 30-year fixed-rate mortgages from 2014 to 2023 and ends with the predicted values by U.S. households as captured in the Federal Reserve Bank of New York in their 2023 Housing Survey. People think the rate will be 8.8% three years from now and 8.4% one year from now.


The first question asked was where they expected mortgage rates to be one year from now. And as you see here that, on average, households expected rates to rise all the way up to 8.4%. Although some may see this as extreme, you can see that in the 2022 survey respondents predicted rates would hit 6.7%, almost exactly where they were at the beginning of this March.

And when asked where they thought rates would be three years from now, on average, households expected to see them climb to 8.8%. Now, that’s a rate we haven’t seen since early 1995!

Well, I’m not sure about you, but I was very surprised by these results as they counter just about every analyst’s expectation regarding where rates will be over the next few years. In fact, myself and every economist I know believes that rates will slowly pull back as we move through this year. I haven’t seen a single forecast suggesting that mortgage rates will rise to a level this country hasn’t seen in decades.

But as they say, the devil’s in the details. When I dug deeper into the numbers, it became very clear to me that demographics played a pretty big part in guiding people’s answers. Let me explain.

1-Year Mortgage Rate Expectations by Education

A double line graph showing mortgage rate predictions. Specifically, it shows the average interest rates for 30-year fixed-rate mortgages from 2014 to 2023 and ends with the predicted values by U.S. households separated by educational level completed as captured in the Federal Reserve Bank of New York in their 2023 Housing Survey. In the light blue line, respondents with a GED or less think the rate will be 9.4% in one year. In the dark blue line, respondents with a Bachelors degree think the rate will be 6.7% one year from now.


Here the data is broken down by educational achievement. You can see that survey respondents who didn’t have a college degree thought that mortgage rates would rise to 9.4% within a year. But college graduates were far more optimistic, and they expected rates to be in the high 6’s.

3-Year Mortgage Rate Expectations by Education

A double line graph showing mortgage rate predictions. Specifically, it shows the average interest rates for 30-year fixed-rate mortgages from 2014 to 2023 and ends with the predicted values by U.S. households separated by educational level completed as captured in the Federal Reserve Bank of New York in their 2023 Housing Survey. In the light blue line, respondents with a GED or less think the rate will be 10.1% in three years. In the dark blue line, respondents with a Bachelors degree think the rate will be 6.4% three years from now.


And when asked to look three years outrespondents without degrees expected rates to break above 10%. While college graduates saw them pulling back a little from their one-year expectations of 6.7%, down to 6.4%.

Now we are going to look at the survey results broken down by housing tenure.

1-Year Mortgage Rate Expectations by Tenure

A double line graph showing mortgage rate predictions. Specifically, it shows the average interest rates for 30-year fixed-rate mortgages from 2014 to 2023 and ends with the predicted values by U.S. households separated by housing status as captured in the Federal Reserve Bank of New York in their 2023 Housing Survey. In the light blue line, renter household respondents think the rate will be 10.9% in one year. In the dark blue line, homeowner household respondents think the rate will be 7.3% one year from now.


And here you see that renters expect mortgage rates to be at almost 11% within a year. And homeowners also saw them rising, but only up to 7.3%. 

3-Year Mortgage Rate Expectations by Tenure

A double line graph showing mortgage rate predictions. Specifically, it shows the average interest rates for 30-year fixed-rate mortgages from 2014 to 2023 and ends with the predicted values by U.S. households separated by housing status as captured in the Federal Reserve Bank of New York in their 2023 Housing Survey. In the light blue line, renter household respondents think the rate will be 12.1% in three years. In the dark blue line, homeowner household respondents think the rate will be 7.4% three years from now.


And over the next three years, renters expected rates to break above 12%. That’s a level not seen since the fall of 1985. But homeowners expected to see rates at a somewhat more modest 7.4%.

So, what does this tell us? I see two things.

Firstly, the rapid increase in mortgage rates that we all saw starting in early 2022 has a lot of people believing that we will see rates continuing to rise, sometimes at a very fast pace, over the next few years. I mean, if it happened before, why can’t it happen again? And this mindset leads me to my second point, which is that it’s very clear that a lot of would-be home buyers just don’t understand how mortgage rates are calculated.

The bottom line here is that I see a potential buyer pool out there that needs educating and that can give an opportunity to brokers to discuss how rates are set and where the market is expecting to see them going forward.

This may alleviate the concerns that many households have who may be thinking that they will never be able to afford to buy a home because of where they expect borrowing costs to be in the future. Education is everything, don’t you agree?

As always, I’d love to get your thoughts on this topic so please comment below! Until next month, take care and I will see you all soon. Bye now.

To see the latest housing data for your area, visit our quarterly Market Updates page.


About Matthew Gardner

As Chief Economist for Windermere Real Estate, Matthew Gardner is responsible for analyzing and interpreting economic data and its impact on the real estate market on both a local and national level. Matthew has over 30 years of professional experience both in the U.S. and U.K.

In addition to his day-to-day responsibilities, Matthew sits on the Washington State Governors Council of Economic Advisors; chairs the Board of Trustees at the Washington Center for Real Estate Research at the University of Washington; and is an Advisory Board Member at the Runstad Center for Real Estate Studies at the University of Washington where he also lectures in real estate economics.

Article originally appears on windermere.com

Whidbey Island Spring Gardening Tips

Contributed by Si Fisher

As springtime tiptoes onto Whidbey Island, seasoned green thumbs and aspiring gardeners alike can't help but feel the irresistible urge to get their hands dirty. Welcome to our little slice of horticultural heaven, where the promise of sun-kissed tomatoes and fragrant herbs is just a trowel's depth away. Whether you're a seasoned pro or a wide-eyed newbie, join us on this whimsical journey through the trials and tribulations of Spring gardening on Whidbey Island.


Whidbey Island Spring Gardening Tips

(6 Tips for a successful Whidbey Island Garden)

Tip #1: Understanding the Climate on Whidbey Island and Choosing the Right Vegetables


Whidbey Island boasts a temperate climate that provides favorable conditions for a variety of cool-season vegetables. With mild winters and cool summers, plants such as peas, lettuces, collards, kale, cabbage, broccoli, and Brussels sprouts can thrive in this region. These vegetables are well-adapted to the area's weather patterns and can be grown with relative ease, making them perfect choices for both beginner and experienced gardeners.

Vegetable Seeds Garden Kit - Non-GMO and Heirloom - 16,000 SEEDS! on Amazon

Certified Organic Vegetable Seed Collection 20-Pack on Amazon


On the other hand, heat-loving vegetables, such as tomatoes, corn, melons, and peppers, may present more of a challenge on Whidbey depending on the microclimate in which your garden is located. These plants require longer growing seasons and warmer temperatures, which can be more difficult to achieve in this region. However, don't be discouraged! With careful planning, the right varieties, and some extra attention, it is still possible to successfully grow these vegetables. Be prepared to invest additional time and effort into their care, as well as research methods to help them thrive, such as using greenhouses, cold frames, or other season-extending techniques.


In summary, understanding Whidbey Island’s climate is crucial for choosing the right vegetables for your garden. By selecting cool-season vegetables and providing extra care for heat-loving plants, you can create a thriving vegetable garden that will yield a bountiful harvest.

Work with a local Realtor® to help find your slice of gardeners paradise

Tip #2: Preparing the Soil for a Successful Garden


A successful garden starts with good soil. Healthy, well-draining soil provides essential nutrients, water, and oxygen to your plants, creating an environment in which they can thrive. In this section, we'll discuss the importance of good soil, the soil types commonly found on Whidbey Island, and how to improve your soil or opt for alternative gardening methods.

The quality of your soil can significantly impact the growth and yield of your plants. Nutrient-rich soil allows plants to develop strong root systems, leading to healthier, more productive plants. Good soil also provides the proper balance of water retention and drainage, ensuring that your plants receive the right amount of moisture without becoming waterlogged.

On Whidbey Island there are two common soil types: sandy/rocky soil and hard clay soil. Both of these soil types can present challenges for growing vegetables, which generally prefer a rich, loamy, well-draining soil.

To improve your native soil, start by conducting a soil test to determine its current nutrient levels and pH. Based on the test results, you can add necessary amendments to improve the soil's structure, fertility, and pH balance. This may include adding organic matter, such as compost or aged manure, as well as specific nutrients or minerals, like lime for acidic soil or sulfur for alkaline soil.


If improving your native soil seems too daunting or time-consuming, consider alternative gardening methods like raised beds or container gardening. Raised beds involve building a frame and filling it with a soil mix specifically designed for gardening, while container gardening involves growing plants in pots or planters. Both options allow you to control the soil quality and eliminate the need to amend native soil.


When using raised beds or containers (Galvanized Raised Garden Bed Kit) , you can opt for pre-mixed soil products designed for gardening, such as FoxFarm Ocean Forest Potting Soil Mix. These products typically contain a balanced mix of nutrients and organic matter to support plant growth. However, it's essential to research the specific needs of the plants you're growing, as some may require additional fertility. Additionally, if you plan to use the same soil for multiple years, you'll need to consider crop rotation and replenishing nutrients through amendments or organic matter.

By understanding the importance of good soil and taking the necessary steps to improve or select the right soil for your garden, you'll create a strong foundation for a successful vegetable garden on Whidbey Island.

Tip #3: Choosing What to Grow in Your Whidbey Island Garden


When planning your vegetable garden, it's important to select plants that align with your family's preferences, available space, and gardening goals. In this section, we'll discuss how to choose the right vegetables to grow, taking into consideration factors such as personal taste, space constraints, and the desire to try something new.

Start by evaluating the vegetables and fruits your family enjoys eating the most. Take a look at your fridge and pantry to identify the produce items you purchase regularly. Growing your favorite vegetables will not only make the gardening experience more enjoyable but also ensures that the produce you harvest will be put to good use.

Consider the space you have available for your garden, as well as the time you can dedicate to gardening tasks. Some vegetables require more space or maintenance than others, so it's essential to choose plants that will fit your garden's dimensions and your schedule. Be realistic about your gardening capabilities and prioritize plants that suit your needs.


Reflect on your past gardening experiences and identify the vegetables that you've had success with in the past. Prioritize growing these plants, as they are likely well-suited to your region and gardening style. Additionally, consider purchasing vegetables that are readily available and inexpensive from local farmers, especially if they require more space or are more challenging to grow. This approach allows you to focus on the plants that you know you can grow successfully and enjoyably.


Purchase goods from local farmers, bakers, fermenters, cooks, and makers from Whidbey Island using the:

THE WHIDBEY ISLAND GROWN COOPERATIVE FOOD HUB!


If you have a favorite vegetable or fruit that is difficult to find at the grocery store or farmer's market, consider growing it yourself. This could be a fun and rewarding opportunity to enjoy produce that you otherwise wouldn't have access to. Some examples of unique plants that could be grown on Whidbey Island include hardy kiwi and ground cherries.


Gardening is an ongoing learning process, and it's important to embrace experimentation and trial and error. Try growing a variety of plants to see which ones thrive in your garden and which ones struggle. This experience will help you refine your garden plan for future seasons, ultimately leading to a more successful and satisfying gardening experience.

By assessing your family's preferences, taking space and time constraints into account, and prioritizing vegetables based on your personal success and local availability, you'll create a garden that is both enjoyable and productive. Don't be afraid to experiment and learn from your experiences; with time and practice, your Whidbey Island garden will flourish.

Tip #4: Deciding Between Seeds or Starts for Your Whidbey Island Garden


One of the key decisions you'll need to make when planning your vegetable garden is whether to grow plants from seeds or purchase starts (young plants). Both options have their advantages and challenges, and the choice ultimately depends on your gardening experience, available time, and personal preferences. In this section, we'll discuss the benefits of using starts, the types of vegetables that do better from seed, and the pros and cons of starting seeds indoors.


For those new to gardening, using starts can be an excellent way to gain experience and confidence in the garden. Starts are young plants that have already begun growing, making them more likely to thrive and produce a harvest. This can be especially helpful for beginner gardeners, as it allows them to focus on learning essential gardening skills without the added challenge of seed starting.


There are a couple great places to get plant starts here on South Whidbey including:

Venture Out Nursery

Bayview Garden


Some vegetables are better suited for direct seeding in the garden rather than transplanting from starts. Carrots, beets, and other root vegetables tend to perform better when grown directly from seed, as transplanting can cause damage to the delicate root systems. Peas and beans also do well when directly sown in the garden.


Starting seeds indoors offers several advantages, including a longer growing season for heat-loving vegetables like tomatoes, peppers, and melons. However, starting seeds indoors also requires additional resources, such as grow lights and trays or pots, and can be more labor-intensive. For those who are up for the challenge, starting seeds indoors can be a rewarding and cost-effective way to grow a variety of vegetables on Whidbey Island.


If you decide to start your own seeds, there are numerous resources available to help guide you through the process. Many gardening websites, blogs, and YouTube channels offer detailed instructions and tutorials on seed starting, covering topics such as choosing the right seeds, providing proper lighting and temperature, and transplanting seedlings into the garden. Venture Out also offers videos and other educational materials to support you in your seed starting journey.


Ultimately, the choice between seeds and starts will depend on your gardening goals, experience, and available resources. Whichever route you choose, remember that gardening is a learning process, and with time and practice, you'll be able to grow a bountiful and enjoyable garden on Whidbey Island.

Tip #5: Timing Your Planting for a Successful Whidbey Island Garden


Planting your vegetables at the right time is crucial for a successful harvest. Timing your planting ensures that your plants have the best possible conditions for growth and are less susceptible to damage from frost or pests. In this section, we'll discuss the importance of understanding frost dates, calculating the latest planting times, and utilizing planting calendars and local resources for guidance.

Frost dates are essential to consider when planning your vegetable garden, as they provide a guideline for when it's safe to plant outside. The first frost date marks the beginning of the growing season, while the last frost date indicates when frost is no longer expected. Knowing these dates for your specific region helps you determine the optimal planting window for each vegetable. To find the frost dates for your area, consult local resources. We have a lot of microclimates on Whidbey Island, and the online tools are not always accurate for our local communities. Reach out to a local nursery, local community gardens, or even your friendly neighborhood gardeners for more localized information about this. I have heard many locals talk about the 1st of May as a safe date from frost, but it’s important to check for your specific area.

When selecting vegetables to grow in your garden, it's essential to consider the length of time they take to grow and ripen. This information, often found on seed packets or plant labels, will help you calculate the latest possible planting date to ensure a successful harvest. Start by identifying the number of days to maturity for each plant and counting backward from the last frost date. This will give you the latest planting date, allowing for a full growing season before the risk of frost returns.

Planting calendars can be invaluable tools for planning your Whidbey Island vegetable garden. These calendars provide a month-by-month guide to sowing, transplanting, and harvesting various vegetables, tailored to your region's climate and growing conditions. Local resources, such as the Deep Harvest Farmplanting calendar for the Pacific Northwest, are particularly helpful as they take into account the unique weather patterns of the area.

Additionally, don't hesitate to seek advice from local experts, such as Master Gardeners, nursery staff, or farmers. These individuals have firsthand experience with growing vegetables on Whidbey Island and can offer valuable insights and tips for timing your planting. Many gardening groups and online forums also provide a wealth of information and support for gardeners of all experience levels.

By understanding frost dates, calculating the latest planting times, and utilizing planting calendars and local resources, you'll be well-equipped to plan your vegetable garden for a successful growing season on Whidbey.

Tip #6: Planting Your Garden for Success on Whidbey Island

Once you've prepared the soil, chosen your vegetables, and timed your planting, it's time to get your hands dirty and start planting your garden. In this section, we'll discuss essential tools for successful planting, following planting instructions for each vegetable, watering considerations, and investing in a quality irrigation system.

Having the right tools at your disposal can make planting your garden a more efficient and enjoyable experience. Some essential tools to consider include a small hand shovel, a hori hori, a larger shovel for bigger plants, a garden fork, gloves, and a stool or knee pads for added comfort. As you gain experience, you may discover additional tools that cater to your specific gardening needs and preferences.

Super Affordable 10 Piece Gardening Set on Amazon

High Rated Hori Hori Knife on Amazon

Extra Thick Kneeling Pad on Amazon

It's important to follow the planting instructions for each vegetable to ensure optimal growth and a successful harvest. These instructions, typically found on seed packets or plant labels, provide valuable information about planting depth, spacing, and proper watering techniques. By adhering to these guidelines, you'll give your plants the best possible chance to thrive in your Whidbey Island garden.

Proper watering is crucial for the health and productivity of your vegetable garden. On Whidbey Island, where the weather is cool and moist, it's essential to strike a balance between providing sufficient water for your plants while avoiding conditions that promote fungal growth. To achieve this, consider using soaker hoses or ground-level watering methods to minimize wetting the plants themselves. Ensuring adequate space between plants for airflow also helps reduce the risk of fungal issues.


A well-planned, high-quality irrigation system can save you time and effort while maintaining optimal moisture levels for your plants. By investing in an irrigation system tailored to your garden's needs, you'll be able to provide consistent water to your plants without overwatering or wasting resources. Additionally, a reliable system can help you maintain your garden's health during periods of drought or when you're away from home.

Automatic Drip Irrigation Kits with Garden Timer on Amazon


With the right tools, proper planting techniques, and an effective watering strategy, you'll be well on your way to planting a successful vegetable garden on the island.

Conclusion: Cultivating Success in Your Whidbey Island Vegetable Garden

New gardeners, take heart! Embarking on the journey of growing your own vegetables is both exciting and rewarding. Remember, every gardener starts as a beginner, and learning from experience is crucial. Embrace the challenges and celebrate your successes, using setbacks as opportunities to learn and improve your skills. As you progress, you'll find that gardening is not only a hobby but a deeply fulfilling and meaningful way to connect with the earth and engage with the world around you.

Whidbey Island boasts a thriving community of farmers, community gardening projects, and passionate hobbyist gardeners. This supportive environment is perfect for nurturing your gardening aspirations. To find the ideal spot for your island garden, work with a local Realtor® who can help you discover your very own piece of gardening paradise. Begin your journey today and immerse yourself in the vibrant Whidbey Island gardening community.


Get connected with other farmers and gardeners on the island use the links below:

Whidbey Island Grown Cooperative Members

Whidbey Island Gardening Facebook Group

Article contributed by:

Will Rising Foreclosures Impact the Housing Market?


How will rising foreclosures impact the U.S. housing market? To give his answer, Windermere Chief Economist Matthew Gardner sheds light on the latest foreclosure data and shows how prepared home buyers are to manage their mortgage debt today compared to the 2000s.

This video on foreclosures is the latest in our Monday with Matthew series with Windermere Chief Economist Matthew Gardner. Each month, he analyzes the most up-to-date U.S. housing data to keep you well-informed about what’s going on in the real estate market.


Rising U.S. Foreclosures

The market has certainly shifted since mortgage rates started skyrocketing last year and, with prices pulling back across much of the country, some have started to become concerned about the likelihood of foreclosures rising—clearly a timely topic given current circumstances.

Hello there! I’m Windermere Real Estate’s Chief Economist Matthew Gardner and for this month’s episode of Monday with Matthew, I pulled the latest data on foreclosure starts and looked and the quality of mortgages that have been given to buyers in order to give you a clear idea of how foreclosures will impact the overall housing market.

For the purposes of this exercise, I’m going to concentrate on foreclosure starts rather than foreclosure filings because data shows us that a majority of homeowners where a foreclosure filing has been submitted to a court by their lender are able to avoid it by refinancing or selling the home, which makes total sense as over 93% of owners in the U.S. have positive equity.


U.S. Foreclosures: Starts 2007-2022

A bar graph showing U.S. foreclosures starts from 2007 to 2022. The numbers spiked in 2009 at over 2 million foreclosure starts and gradually decreased every year until 2022, where the numbers increased from 2021. Though they were 181% higher in 2022 than in 2021, it’s important to note that foreclosure starts in 2022 were 31% lower than 2019 and 88% lower than the 2009 peak.


As you can see here, foreclosure starts rose significantly last year. In fact, they were 181% higher than in 2021. But if we zoom out, it’s important to note that foreclosure starts were 31% lower than 2019 and 88% lower than the 2009 peak.

Am I surprised at the increase in foreclosure starts? Not really. The forbearance program was put in place at the start of the pandemic, and it allowed homeowners to temporarily stop making mortgage payments and not be foreclosed on, but that program ended 18 months ago.

And, although a vast majority of the 4.7 million households who entered the program have left it and sold or refinanced their homes, there were always going to be some who were not able to, and this has led to the overall foreclosure activity rising. Let’s take a closer look.


U.S. Foreclosures in 2022

A map showing foreclosures starts for each state in the U.S. California, Texas, and Florida have the highest number of foreclosure starts inn 2022. California had 27,541, Florida had 24,190, and Texas had 23,151.


This is a heat map of foreclosure starts by state. And you can see that California, Florida, and Texas saw the highest numbers in 2022. But remember that these are the states that have the greatest number of homes with mortgages so, statistically, we would expect the total number of homes in foreclosure in those states would be higher than the rest of the country. That said, foreclosure starts were significantly higher in Florida, California, Texas, and New York than they were in 2019, the last “pre-COVID” year and before the forbearance program started.

And when we look more myopically, metro areas including New York/New Jersey, Washington DC, the Delaware Valley, Atlanta, Miami, Baltimore, and Dallas all saw total foreclosure starts rise well above what they were in 2019. This may suggest that there are some markets that could see foreclosure activity rise to a level that could materially impact housing in those locations.

But looking at the country as a whole, there are other factors leading me to believe that we will not see the number of homes entering foreclosure rising above the long-term average, and certainly not sufficient to have a material impact on U.S. housing prices. 

Let me show you what’s happening on the mortgage side of things. First: credit quality.


Median FICO Scores for New Mortgages 2003-2022

A line graph showing the median FICO scores for new mortgages from Q1 2003 through Q3 2022. The median FICO score generally decreased from 2003 to the low of 707 during 2007, then gradually increased throughout the years 2008-2022. The median FICO score inn Q3 2022 was 766.


The median FICO score for new mortgages was 766 in the 4th quarter of 2022. Yes, this is down from the peak seen in early 2021 when it was a whopping 788 but as shown here, it’s far higher than we saw before the housing crisis. Buyers over the past several years had very good credit and, given the tight labor market, we are certainly in a very different place than back before the housing bubble burst.


Mortgage Debt Payments Percentages 2007-2022

A line graph showing mortgage debt payments as a percentage of disposable personal income for home buyers from Q1 2007 through Q3 2022. In 2007, mortgage debt payments were around 7% of disposable personal income, in Q3 2022 it was 3.99%. Between those two points in time, the percentage gradually and consistently decreased.


Secondly, buyers are using larger down payments than in the mid-2000’s, and with the historically low mortgage rates that we saw during the first two years of the pandemic benefitting new buyers as well as allowing existing homeowners to refinance, the share of disposable income that is used to cover mortgage payments remains very low. This basically means that owners aren’t as burdened by their house payments as they were in 2007-2009. And finally…


Equity Rich Households Q4 2022

A map showing the percentage of equity rich households for each state in Q4 2022. The highest values are Vermont at 76.6%, Florida at roughly 62%, and California at 61.5%.


With the significant run-up in housing values that we have seen over the past few years, 48% of all homeowners with a mortgage have more than 50% equity. Although this share has pulled back a little as mortgage rates rose and values pulled back, it’s still a massive amount of money and, as I mentioned earlier, many homeowners who are faced with foreclosure will end up selling their homes as they still have positive equity rather than go through the foreclosure process.

So, my answer to those of you wondering if we will see foreclosures rise to a level that could impact the overall housing market is “no.”

I don’t see any reason to believe that distressed sales will hurt the market in general, but I will say that there are some local markets where distressed sales could rise to levels that could act as a headwind to price growth in these areas. As always, I’d love to get your thoughts on this topic so please comment below! Until next month, take care and I will see you all soon. Bye now.


To see the latest housing data for your area, visit our quarterly Market Updates page.


About Matthew Gardner

As Chief Economist for Windermere Real Estate, Matthew Gardner is responsible for analyzing and interpreting economic data and its impact on the real estate market on both a local and national level. Matthew has over 30 years of professional experience both in the U.S. and U.K.

In addition to his day-to-day responsibilities, Matthew sits on the Washington State Governors Council of Economic Advisors; chairs the Board of Trustees at the Washington Center for Real Estate Research at the University of Washington; and is an Advisory Board Member at the Runstad Center for Real Estate Studies at the University of Washington where he also lectures in real estate economics.

Article originally appears on windermere.com

How to Determine the Best Time to Sell

Your Whidbey Island Home

Contributed by Si Fisher

Selling a home is a big decision, and timing is crucial. If you're looking to sell your home on Whidbey Island, you'll need to consider the local housing market, your financial readiness, and finding the right agent. In this guide, we'll walk you through the steps to help you make the best decision for your needs.


Ready to Sell?

(Get Your Ducks in a Row!)

Before selling your home, you need to be financially ready. To determine the equity you have in your property and the current market value, you'll need a comparative market analysis (CMA) from a real estate agent familiar with Whidbey Island's unique housing market. You don't want to leave any money on the table by underpricing your home or missing out on potential buyers due to overpricing.

You'll also need to consider the costs of selling, such as brokerage fees, repairs, inspections, and staging. A good agent will help you budget for these expenses, and determine what things are the most important so you're not caught off guard. Additionally, selling your home can be an emotional experience, and it's essential to ensure you and your household are prepared for the changes that come with the process.


Local Market Conditions

(What's the Scoop on Whidbey Island?)

Whidbey Island's real estate market is unique, and timing is everything. Factors such as seasonality, inventory, mortgage rates, and home price growth can affect the local housing market's state. To make the best decision for selling your home, you'll need to consult with an experienced real estate agent familiar with Whidbey Island's market conditions.

Our island's housing market is continually changing, and staying up to date on the latest trends and statistics can give you a competitive edge.  The island's location, natural beauty, and vibrant community make it a sought-after location for homebuyers.


Find the Right Agent

(We're More Than Just Pretty Faces!)

Choosing the right agent is vital to a successful home sale. An experienced real estate agent will help you understand your selling goals and how to achieve them. They can provide valuable insights into Whidbey Island's unique housing market, help you price your home correctly, and market it effectively to reach the right buyers.

Don't settle for just any agent! Take the time to interview multiple agents, ask for referrals, and choose the one that aligns with your needs. At Windermere Whidbey, we pride ourselves on our extensive knowledge of Whidbey Island's real estate market, our attention to detail, and our personalized approach to each client.


Contact A Windermere Whidbey Agent

(We're Always Here to Help!)

When you're ready to sell your home on Whidbey Island, contact an experienced Windermere Whidbey agent. We'll work with you to understand your needs, assess your financial readiness, and develop a selling strategy that maximizes your profit. Our agents are familiar with Whidbey Island's unique market conditions and can provide valuable insights to help you make informed decisions.

Article contributed by:

Contact a local expert to get expert advice about selling your home